 PB01 · IMAGE PENDINGSpectrophotometer measuring an optical filter
Quality & Spectral Testing
Every published curve is a real measurement
A filter is only as good as the measurement that proves it. Every coating run is measured before it ships, and every spectrum on this site is a real measurement that states the instrument, angle and polarization it was taken at. This page explains what we measure, how, and what data comes with your order.

Spectral Measurement From 175 to 3,300 nm
Transmission spectra are measured on an Agilent Cary 5000 UV-Vis-NIR spectrophotometer, which covers 175 to 3,300 nm. It produces the curves for our bandpass, edge, notch, ND and infrared filters within that range, at the resolution each filter needs, down to fine steps for our ultra-narrow laser-line filters.
Dichroics, beamsplitters and mirrors work at an angle, so we measure them on an Agilent Cary 7000 Universal Measurement Spectrophotometer. It records absolute reflectance and transmittance at different angles and in s- and p-polarization without remounting the sample, with control of beam collimation and spot size. That is how our 45° parts come with separate s, p and average curves.
For narrowband filters, our high-resolution measurements resolve spectral features down to 0.0025 nm.
Example: a measured spectrum
Actual wavelength / transmittance CSV is required to display transmission and OD. No representative curve has been invented.
BPF450-30,OD6, AOI 0°, unpolarized, Agilent Cary 5000.
What We Measure
Spectral performance
Center wavelength, bandwidth, transmission and blocking against the specification, typically to ±2 nm on wavelength and down to ±0.3 nm on ultra-narrow filters. Transmission is checked as average, absolute or peak, whichever the spec states.
Angle and polarization
Filters are specified at 0 ± 2° for most models, 3 ± 2° for our LiDAR series, and 45° with s- and p-curves for dichroics. We measure at the angle the filter was designed for.
Surface and figure
Scratch-dig checked to the specification, 60-40 as standard and 40-20 on fused silica laser windows. Surface flatness is measured on our interferometer, to λ/10 on polished flats; lenses are made to λ/4.
Dimensions
Diameter, outline and thickness checked against your drawing with micrometers and a vision measuring system. Lens diameters are held to −0.03 mm.
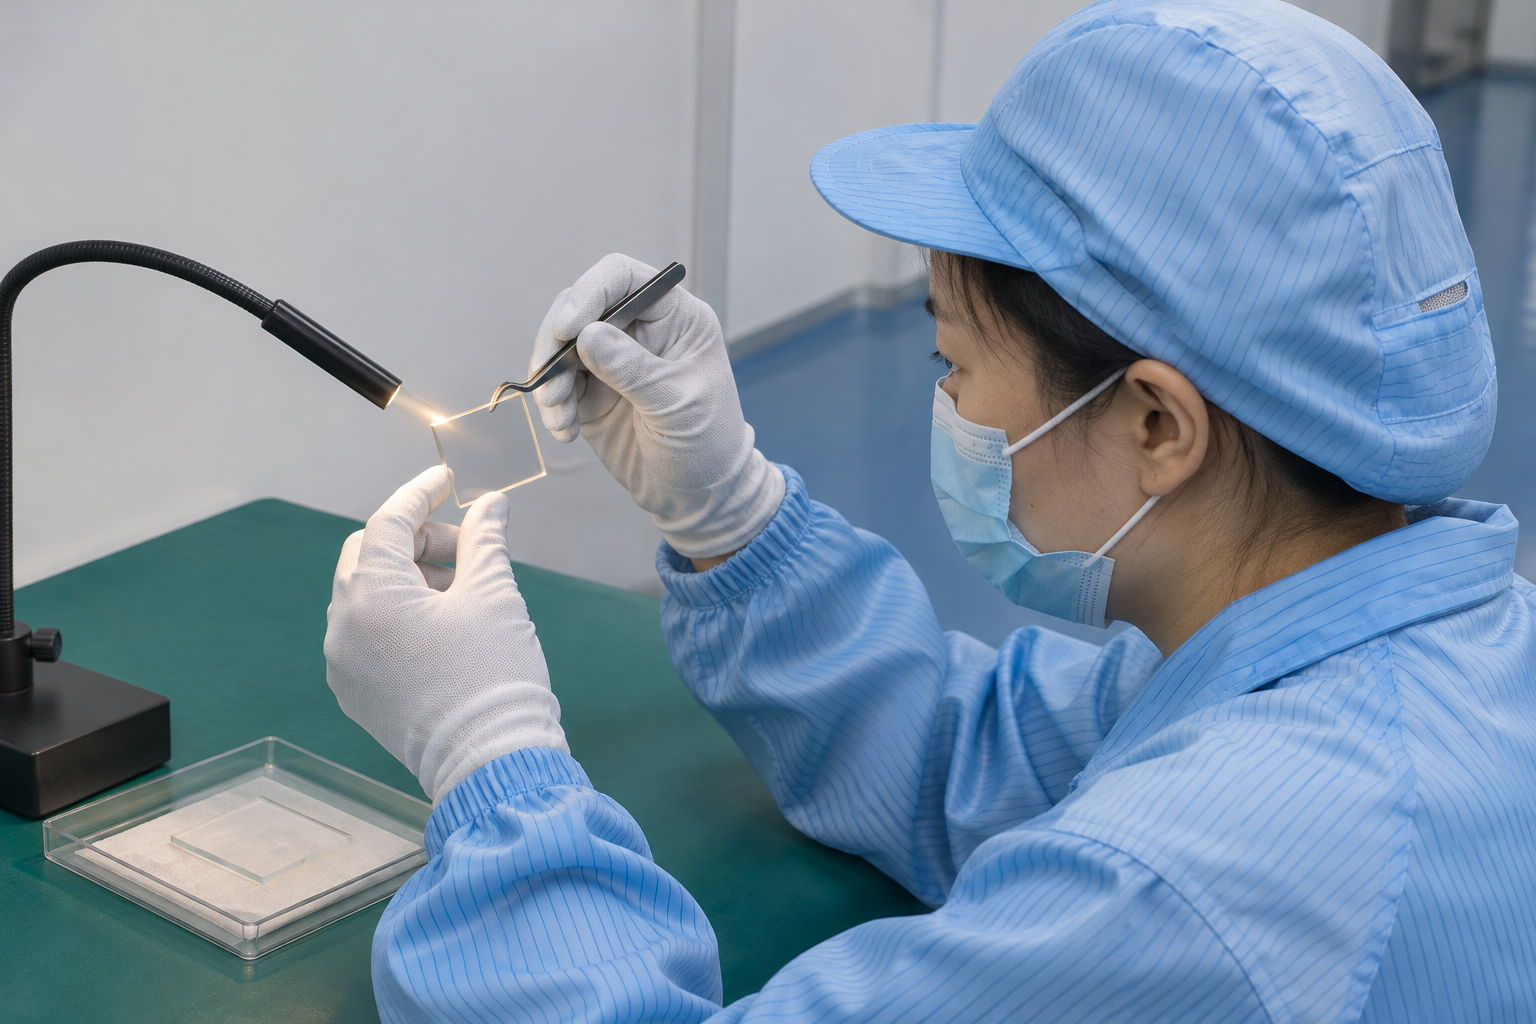 P03 · IMAGE PENDINGOptical Filter Surface Inspection
Measurement Capabilities at a Glance
| Measurement | Instrument | Range / limit |
|---|---|---|
| Transmission spectra | Agilent Cary 5000 | 175–3,300 nm |
| Reflectance and transmittance at angle, s / p | Agilent Cary 7000 UMS | Variable angle, s and p polarization |
| Optical density | Cary 5000 | to the instrument floor, about OD5–OD7 |
| Mid-infrared spectra | FTIR spectrometer | to 15 µm |
| Transmitted wavefront and flatness | Interferometer | to λ/20 wavefront, λ/10 flatness |
| Parallelism | Autocollimator | 5 arc seconds or better |
| Surface quality | Visual inspection against scratch-dig standards | 60-40 to 20-10 |
| Dimensions | Micrometers, vision measuring system | 0.01 mm |
How to Read Our Spectra and Specs
Each chart can switch between percent transmission on a linear scale and optical density on a log scale. Transmission shows the passband; OD shows how deep the blocking goes.
The stated specification is what we guarantee. Transmission is stated as average (Tavg), absolute minimum (Tabs) or peak (Tpeak), so check which one applies. View details
The stated specification is what we guarantee. Transmission is stated as average (Tavg), absolute minimum (Tabs) or peak (Tpeak), so check which one applies. Learn more
About high OD. In deep blocking regions, a spectrophotometer eventually reads its own noise floor, typically somewhere around OD5 to OD7. Our OD charts stop at that floor and mark it “below instrument floor” instead of drawing noise as data. Where a spec says OD6, the stated value is the guarantee; on some multiphoton filters, OD above 800 nm is marked as noise-limited.
Beyond 3,300 nm
Our mid-infrared filters at 3.95, 4.75 and 7.35 µm sit beyond the Cary 5000’s range. Their spectra are measured on our FTIR spectrometer. Learn more
Data That Comes With Your Order
A filter that measures well on day one also has to survive cleaning, humidity and temperature in the field. We test coatings to the conditions your product will see.
- Measured spectrum per batch, as a chart and a CSV file
- Certificate of conformance
- First-article inspection report
- Traceability from coating run to shipped part
Measured data saves you incoming inspection. Each shipment includes the measured spectrum for its batch, as a chart and as a data file. On request we also supply a certificate of conformance, a first-article report or a test report in your format.
Need a specific test, a witness sample or a report template? Tell us when you order, so we can plan it into the run.
 P05 · IMAGE PENDINGOptical Filter Test Report and Spectral Data
Quality System
Our quality management system is certified to ISO 9001:2015, and every product is 100% inspected. Every order follows the same steps: incoming glass inspection, in-process checks after polishing and coating, and final inspection before packing.
We specify and inspect to recognized optical standards, such as scratch-dig grades for surface quality. We work to MIL-PRF-13830B for surface quality and ISO 10110 for optical drawings.
Certificates and documents
Certificates and documents
Need Specific Test Data?
Tell us the test, the format and the acceptance criteria when you order. We will confirm what we can measure in-house and plan it into the run.
Tell us the test, the format and the acceptance criteria when you order. We will confirm what we can measure in-house and plan it into the run.